The challenge: tracking and explaining scientific data on the Bay’s health in a way that the average person can understand, and stakeholders will find helpful. The answer? The Chesapeake Bay report Card.
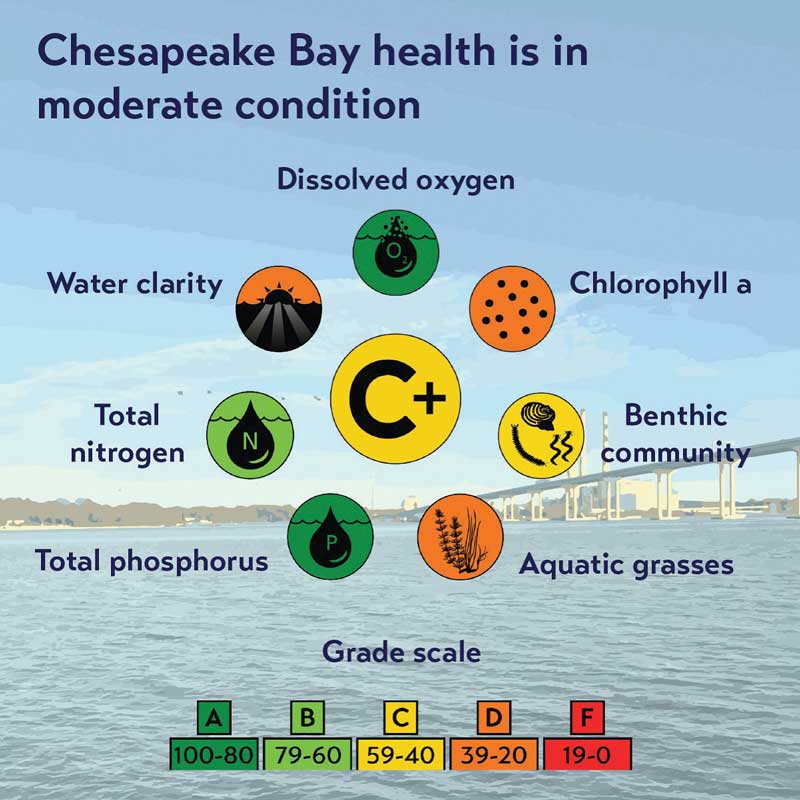
This year’s Chesapeake Bay and Watershed Report Card (2023/24), published July 9 by the University of Maryland Center for Environmental Science (UMCES) Integration and Application Network, tells us that the watershed’s health is in moderate condition, earning a letter grade of C+.
How would you feel about earning a C+? If it was an improvement from your last report card, you might feel pretty good. The Bay, which is overall showing a significant improving trend, improved to a C+ for the first time in 22 years.
“The Chesapeake Bay restoration is seen as a global model of sustainability,” said Fernando Miralles-Wilhelm, president of UMCES. “The Report Card shows that the results are moving in the right direction, but we need to pick up the pace of these efforts particularly in light of climate change which will make meeting the targets more difficult.”
To create the report, the authors divide the Bay into 15 regions: Upper Bay; Upper Western Shore, Patapsco and Back Rivers, Lower Western Shore, Patuxent, Potomac, Rappahannock, York, James, and Elizabeth Rivers, Lower Bay, Lower Eastern Shore (Tangier), Mid Bay, Choptank River, and Upper Eastern Shore.
Regions with significantly improving trends are the James, Elizabeth, Patapsco and Back Rivers, the Upper Bay, and the Upper Western Shore. The Upper Eastern Shore exhibited a slightly declining trend.
To capture a comprehensive view of the watershed, the report categorizes seven Bay indicators and 12 watershed indicators. The Bay indicators, which assess aquatic ecosystem conditions, are total phosphorus, total nitrogen, dissolved oxygen, benthic community (measures the condition of organisms living in or on the bottom areas of the Bay), water clarity, chlorophyll (a measure of phytoplankton), and aquatic grasses.
The watershed indicators, which cover ecological, societal, and economic aspects, are protected lands, water quality, fish community, stream benthic community, stewardship, heat vulnerability, social index, walkability, median household income, jobs growth, income inequality, and housing affordability.
For the reader-friendly report with colorful and easy-to-interpret graphics, visit chesapeakebayreportcard.org.